Back in 1981 Tversky and Kahneman published “The Framing of Decisions and the Psychology of Choice”. In one experiment students were presented with a disaster scenario and asked to choose between two possible solutions. Both had the same expected outcome – a certain number of lives saved, and a certain number of deaths. In a rational world, the respondents should have given equal preference to each scenario but in reality, most students favoured the options which were “framed” around the certainty of saving lives, irrespective of their number.
“Framing” is a human behaviour that describes how the way in which choices are presented can influence our thought processes and ultimately our decisions. Commercial real estate investment markets are no exception and there is plenty of evidence that many of our current investment decision making processes are fundamentally flawed because of how we label and use much of the information and data available to us.
More often than not, real estate assets and investment vehicles are categorised in risk terms according to familiar yet subjective style labels such “core”, “core +”, “value add” or “opportunistic”. Similarly, risk/diversification is usually described in terms of geography or sector – New York offices, German logistics or West End retail but has anyone bothered to ask themselves why we group things in this way? What empirical evidence exists to make this assumption?
Surely any experienced researcher would first analyse asset level performance, identify a range of shared characteristics/performance drivers and THEN decide which of those factors should be used to group them. Yet we all seem happy to accept our data pre-packaged.
The use of these labels serves to reinforce the idea that geographical market and asset sector returns are something that can be assessed in the same way as equity or fixed income market indices. The implication is that these groups of assets are homogenous, have shared risk return characteristics and behave in certain way.
This in turn has led to the mistaken belief that investors can “buy the market” – i.e. City offices – by acquiring assets in the same location/sector. The reality is of course, quite different.
So, let’s dig a little deeper.
Risk Labels
In fixed income markets investment decisions are based on the risk/return trade off which is reflected in the bond rating. The bond yield reflects the perceived risk of default so a low risk borrower (i.e. German government) can borrow more cheaply. In short, investors broadly understand what they are getting when they buy a AAA or a BBB bond.
Unfortunately, things get vague very quickly in commercial real estate. Ask 3 investors to define what constitutes a “prime” investment asset and you will get 3 different answers although there are some key themes that are repeated. One example of this is volatility.
Most investors assume the “prime” properties are inherently less volatile than their non-prime peers but this rule of thumb is not borne out in reality. The long-term performance of prime sub markets is often more volatile than the national average.
Chart 1 – Core European Office Markets – Volatility of Total Returns 1998-2016 Standard Deviation of Total Returns
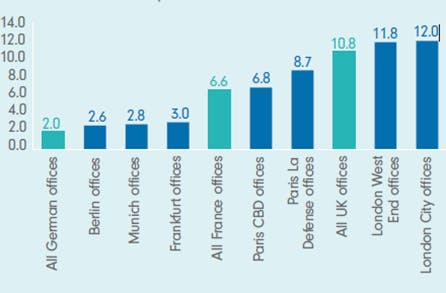
Source: Fidelity International, MSCI, December 2017
Unlike in other asset classes where quality segments can be identified empirically based on risk/return metrics, the decision to label properties as ‘Core’ or ‘Core +’ is largely a subjective exercise based on the physical appearance, location and/or age of the building. This means that we risk grouping assets together in a manner that implies a greater level of homogeneity than is actually the case. While they have some informational value, these labels typically do not take account of other influential drivers of real estate risk/return such as lease structure, liquidity and tenant quality.
Myth of buying the market
It’s important for investors to recognise that it’s almost impossible to access the average market return because its more of a statistical quirk than an achievable investment target
By way of example let’s consider the MSCI Frankfurt office market return in 2011. The average total return was 2.4% yet the difference between the best and worst performing assets in the index was a staggering 330 basis points (33 percentage points). Indeed no one single asset actually delivered the benchmark return in 2011.
Chart 2 – Asset Level Performance
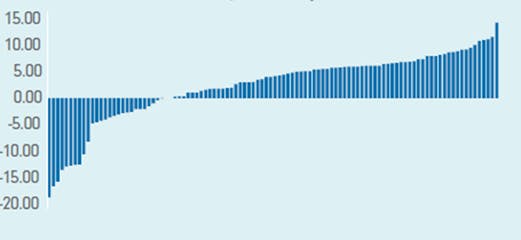
Frankfurt Office Market 2011 – Total Return by Asset - % Per Annum
Source: Fidelity International, MSCI, December 2011
Buying an office in Frankfurt, or indeed a random sample of Frankfurt offices, does not provide the ‘Frankfurt office market return’ - it provides exposure only to a specific asset or a group of heterogeneous assets. To receive the average market return, an investor would need to own a fraction of every constituent (i.e. every one of the 104 buildings). This is, of course, impossible in real estate, where active management is essential - but investors should be aware from the outset that investments may produce very different returns depending on the strategies undertaken (and the properties acquired) by the property investment manager. The use of industry labels works against this aim.
Property-specific factors often wield far greater influence on real estate than regional or sector trends. An individual asset’s risk-return characteristics also change over time. A building will age, and as technology advances, its suitability for prospective tenants will evolve.
In the final analysis the term “property market” is also something of a misnomer. In property markets each asset is unique and the price (or market) is made between the buyer and the seller. It is not based on the evidence of thousands of identical transactions as occurs in equity and debt markets.
Because conventional labels mask key differences between individual properties, investors who try to make top-down sector “calls” in real estate are likely to be disappointed. Equally, given the wide distribution of returns within each category, the volatility of the total market is not an accurate representation of an individual portfolio’s risk.
So, what?
The sector, style, and geographic labels that are widely used in real estate investing are crude measures for assessing the underlying risk, return, and diversifying qualities of heterogeneous commercial property investments. One could argue that geography matters only to the extent that it has the possibility to alter income cash flows via taxation, lease structure and business practices. Beyond that, the performance and volatility of real estate is primarily a function of the individual assets within a portfolio, and property-specific research is therefore essential.
The industry would better served by placing less reliance on market level indices and spending more time analysing asset level performance and/or developing risk/return models that are bottom up rather than top down in nature.
This requires commercial property investors having ready access to clean and organised lease, asset and fund level information along with the analytical tools to accurately quantify the real risk return profile of their investments/strategies.
Unfortunately, much of this data currently is buried deep within a range of in-house systems or spreadsheets that cannot be easily accessed or analysed. The good news is that recent changes in technology are making this relatively simple and cost effective to resolve – provided there is a willingness and desire to change.
The commercial real estate industry could resolve many of the issues currently connected with data “framing” by simply organising in-house data assets better. This would allow us to use empirical evidence to determine the key drivers of performance and the risk profile of an asset or portfolio rather than arbitrary subjective labels.